Health & Fitness
Belmont Home Sales in July Show Steady Improvement
Pricing your home correctly remains crucial even when inventory levels are low and demand high.
SALES
Homes sales for Belmont in the month of July are in and there are no real surprises—to us. Belmont home sales continue along a healthy path with 25 sales in July 2012.
To put this intro perspective, in the market’s heyday, back in 2003 for example, there were 37 sales in Belmont for the month of July. Contrasting that to last July when there were fourteen, one can see that not only have sales increased, they have done so at a reasonably healthy and more sustainable pace.
Find out what's happening in Belmontwith free, real-time updates from Patch.
Of course the number of homes available for sale has an impact on how many sales there are as well. If there aren’t enough homes to choose from, even if willing and able buyers are chomping at the bit to get a new home, it’s sometimes just not possible to satiate the appetite for the current pool of buyers. Simply put, if there aren’t enough homes to sell, sales will be down.
For example, in 2003 there were 37 new listings in the month of July and the inventory of available homes to purchase stood at 60. This July, there were only 25 new listings and the inventory of homes for sale a paltry 39.
Find out what's happening in Belmontwith free, real-time updates from Patch.
Now if we look at July of 2011, we find the new listings that month stood at 28, the inventory at 60 (like in 2003) but resulted in only 14 sales.
This is where the Months of Inventory statistic comes in handy. This statistic is a calculation of the number of available homes for sale (inventory) divided by the number of home sales in a given month. What it seeks to analyze is the pace at which homes are selling as compared to new listings and inventory.
For example, sales could be down in a given month for several reasons. There just aren’t enough homes to sell or buyers are not buying homes due to external factors such as unfavorable interest rates, lack of job security or overall economic variables which drive down consumer confidence. Either scenario would result in low monthly home sales but for two diametrically opposed reasons.
The Months of Inventory for Belmont in July of 2011 stood at just over four. This July, the time in months that it would take to sell the entire existing inventory at the current pace of homes sales dropped to 1.4.
MEDIAN PRICE
The median price reported for Belmont for July was $950,000, just slightly ahead of last July when it stood at $932,500. That amounts to an increase of less than 2%. Looking at the size homes that sold in these two periods we see that in 2012 the median home size was 2,020 square feet as compared to last July’s 1,985. While 35 square feet is well inside the margin of error, at $477 per square foot that could add another $16,695 to the median price in 2011 making it $949,195 or essentially flat year over year.
DOM [Days on the Market]
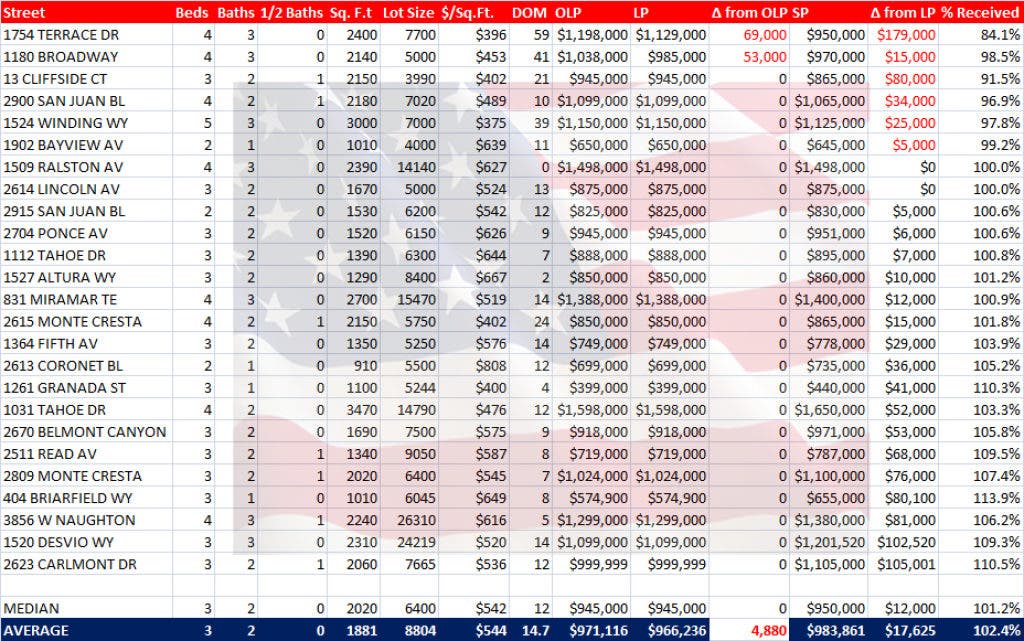
The average time it took to sell a home in Belmont this July was only 14.7 days. Last July it took 33.6. What’s important to note is that these are statistics for sold homes. The average home for sale in Belmont has been on the market over 90 days!
PERCENT RECEIVED OF ASKING
Belmont sellers must be thrilled to see they are getting closer to their asking price—a high not seen since 2007.
The average Belmont home seller received 102.4 % of their asking price.
Only two sellers this last July had to lower their initial asking price as compared to one last year—representing less than 1% of all homes sold in each year.
This July 24% of homes which sold closed under asking for on average $56,000 less, while in 2011 36% of all sales sold for on average $36,000 less.
Each year two homes sold right at the seller’s asking price. In 2012, 68% sold over asking by on average $45,000, while in July of 2011 50% of all sales were over the seller’s asking price for on average $37,000 more.
It’s interesting to note if you are a seller that every home which was priced well sold in nine days or less and none of these seller’s had to lower their asking price. In fact, of the homes that sold in nine days or less without price reductions the seller received on average 106% of their asking price.
Of the sellers who had to lower their asking price by on average $61,000 to attract a buyer, those homes sold for 91% of their asking price—a 14% swing!
Pricing your home correctly remains crucial even when inventory levels are low and demand high.
Clearly our local market has changed direction this year. If you were to read our post last July when the market was flat with no real expectation on the foreseeable horizon of a change, you’d see that we call it like we see it. Why? It’s our job to sell homes and we do so whether the market is going up or down. We feel it’s our responsibility to deliver as accurate a picture of the current Belmont home market as possible so that buyers and seller alike can make informed decisions.
*Data was supplied by MLS Listings for San Mateo County
Disclaimer: The information contained in this article is educational and intended for informational purposes only. It does not constitute real estate, tax or legal advice, nor does it substitute for advice specific to your situation. Always consult an appropriate professional familiar with your scenario.
Drew & Christine Morgan did not necessarily participate in these sales.
